
Planning an MPA network using time-series data
Background
Time-series data derived from monitoring of species and human threats can provide useful information on the spatio-temporal interactions between mobile wildlife and human threats, and thus inform the selection of priority areas for biodiversity conservation. However, temporal patterns of biodiversity have received much less attention than spatial distribution data in systematic conservation planning. Monitoring, especially in the marine environment, is often costly and technically challenging. Therefore, an assessment of the monitoring period needed to ensure sufficient data input in the design of a network of protected areas is crucial to ensure the network’s efficiency, adequacy, and representativeness.
In García-Barón et al. (2021), we developed an approach to demonstrate the value of time-series data in conservation planning by using Marxan and data from different monitoring periods to identify priority conservation areas for highly mobile marine megafauna accounting for their main threat: commercial fishing.
Conservation planning scenarios
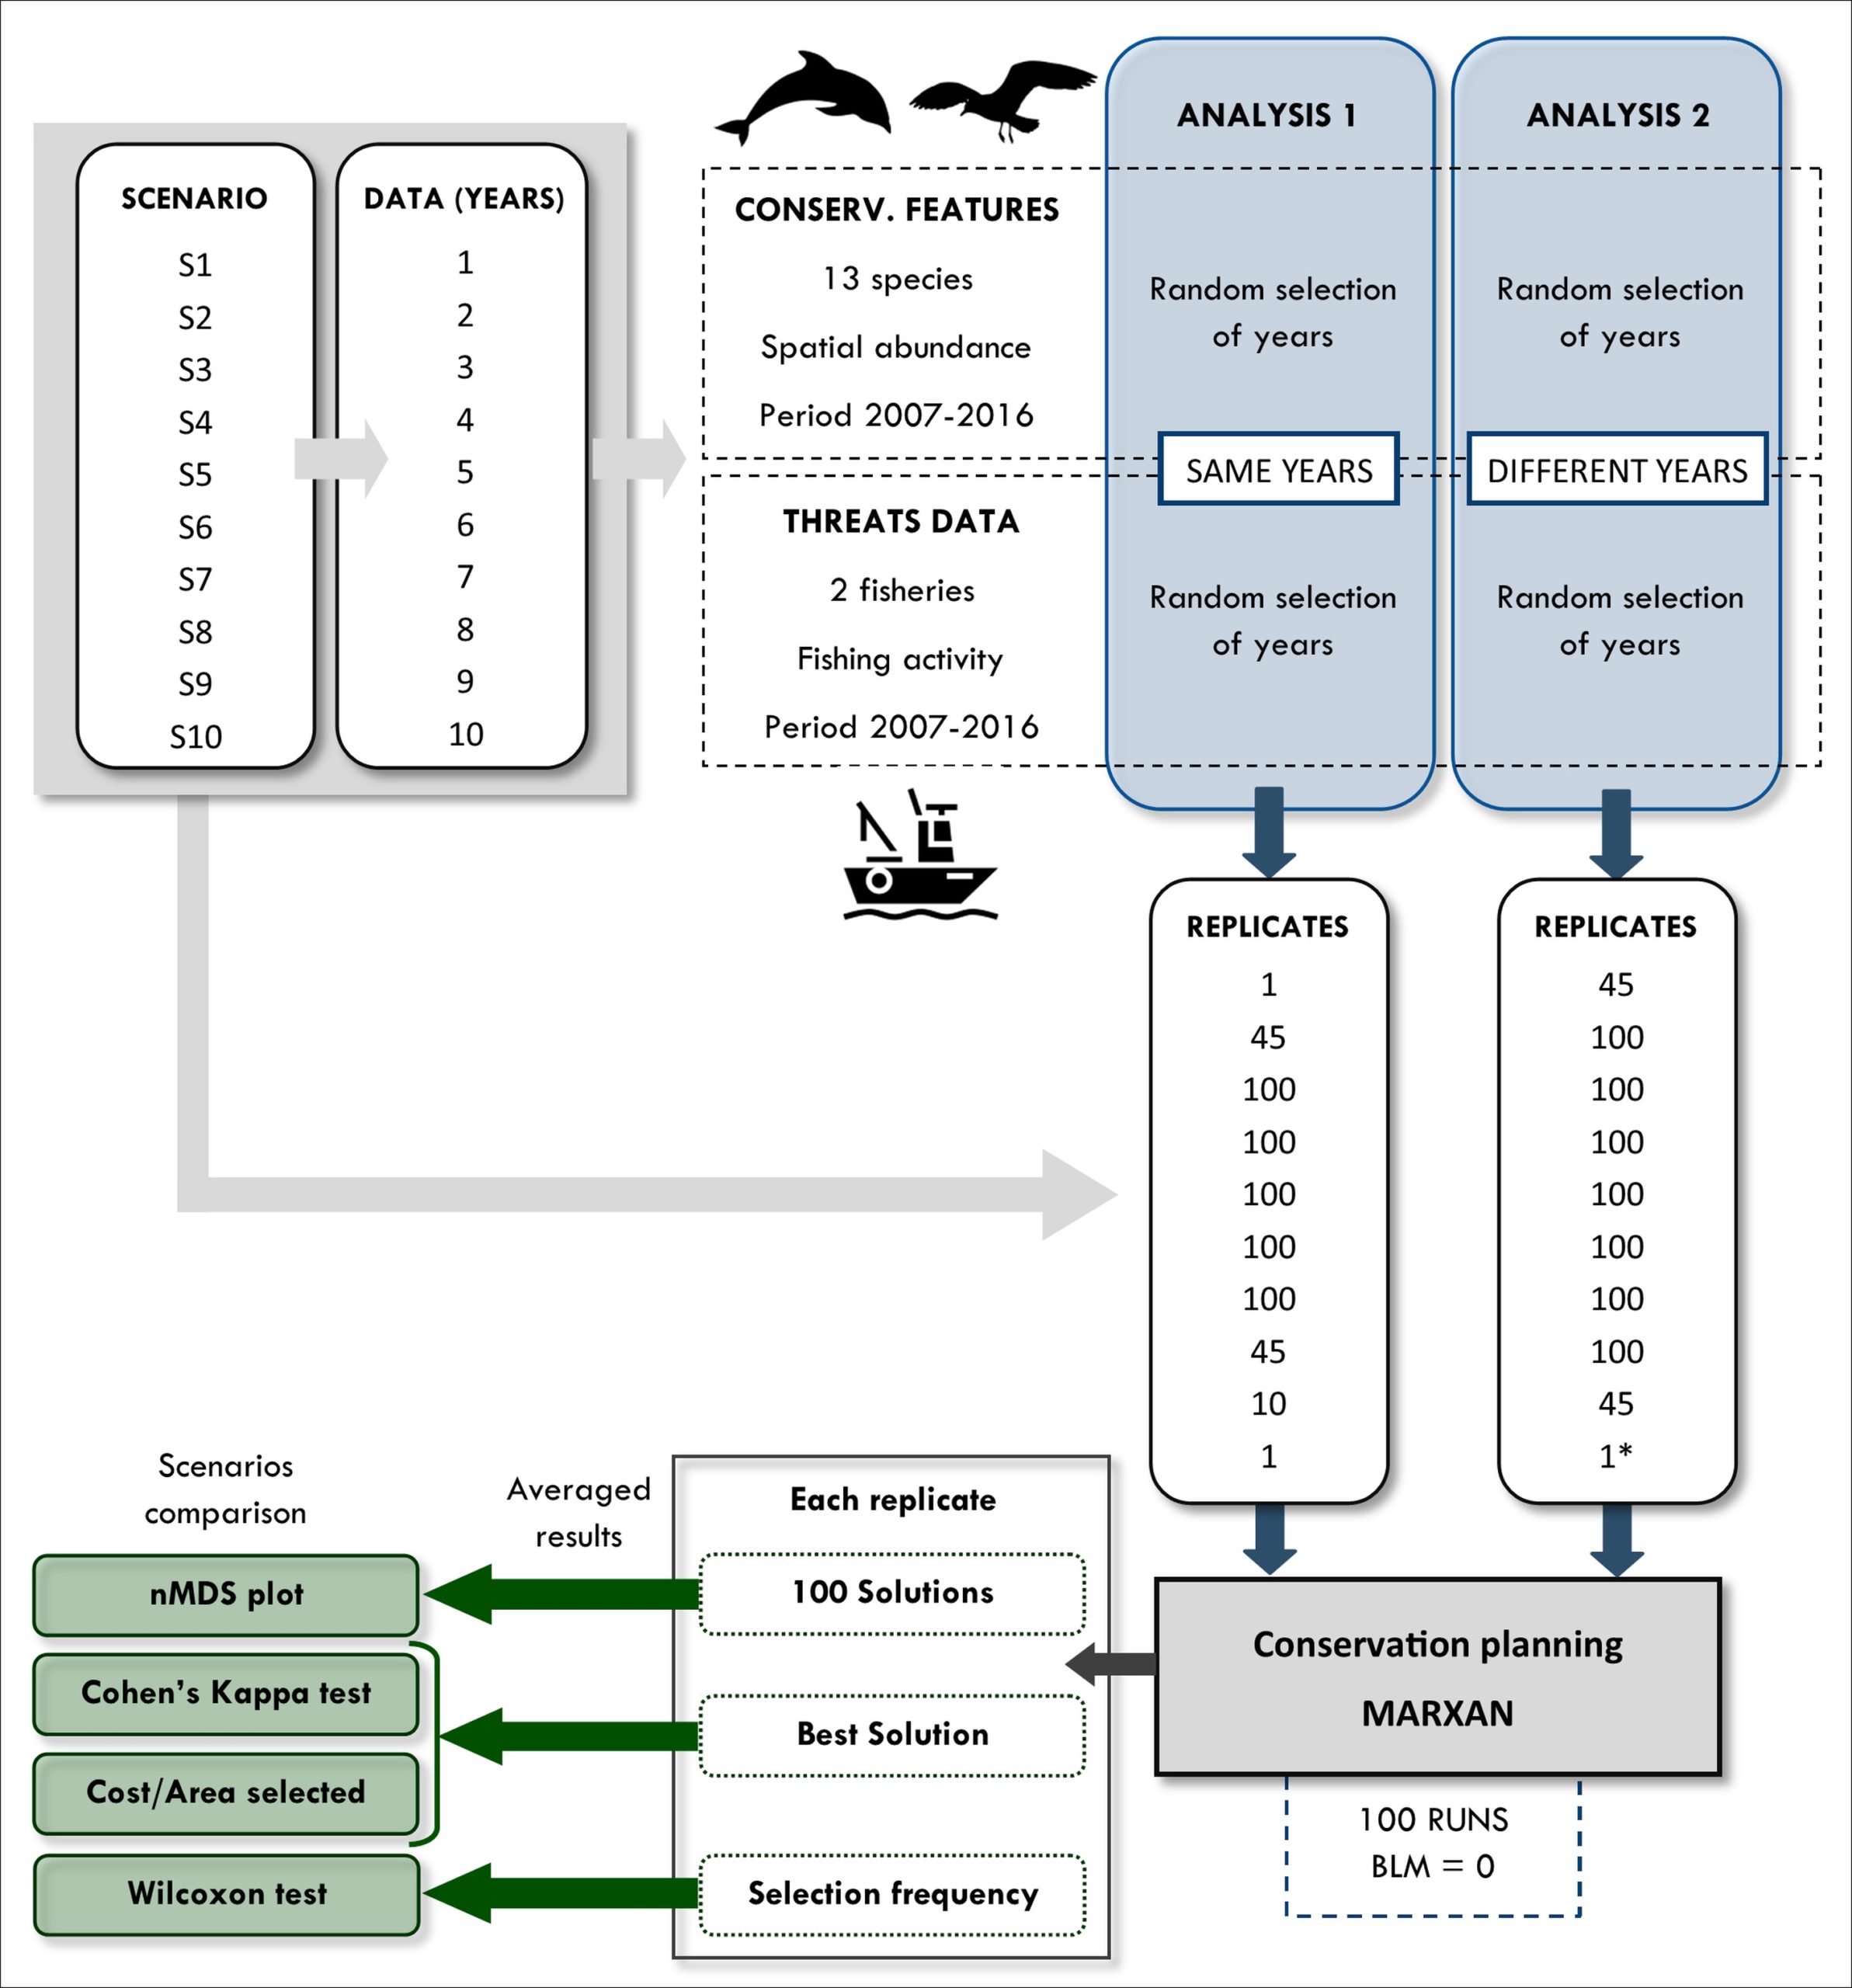
Marxan was used to produce alternative plans for the conservation of ten seabird and three cetacean species in the North-western Spanish continental shelf based on scenarios using different temporal coverage data. Trawl and gillnet fishing were considered the most important threats for our conservation features in the area due to bycatch and we used Vessel Monitoring System (VMS) data to estimate the spatio-temporal distribution of these activities.
Ten scenarios integrating different amount of data from the 10-year time series were built to perform a two-fold analysis with scenarios composed by data derived from: (1) the same combination of years (2) a different combination of years. Thus, to aggregate the conservation features and threats data of the scenarios composed by more than 1 year, the mean abundance and fishing effort per Planning Unit over the combinations of years included in each scenario was calculated. The planning scenarios were compared using different statistical tests (the Cohen's Kappa statistic, the Wilcoxon nonparametric pair difference test, a non-metric multidimensional scaling analysis) and by comparing the total area selected and cost among scenarios.
Results
Overall, the results showed that the more temporal data were used to build the scenarios, the more similar were the conservation planning solutions. More specifically, Cohen's Kappa pairwise comparisons between the averaged best solution of each scenario and the scenario with all the available data (S10) showed that when using 4 or more years of monitoring the best solutions were in almost perfect agreement.
The Wilcoxon test between the averaged selection frequency of each scenario and the S10 found no significant differences among scenarios using 3 or more years of monitoring data in the case of Analysis 1. However, in the case of Analysis 2, there were no significant differences among the scenarios using 7 or more years of data.
The nMDS plot showed for both analyses a clear grouping of all the scenarios but the S1, S2 and S3. Furthermore, both nMDS plots showed how spatial similarity in the selection frequency increases as more data are added to the scenarios. For both analyses, the selection frequency maps showed similar areas of high irreplaceability which become apparent as the quantity of data included in each scenario increased.
Regarding the average percentage of area selected by the best solutions of each scenario, Analysis 1 showed significant differences in all the pairwise comparisons except for the pairs: S10–S9, S10–S8, S10–S7 and S3–S6. In the case of the Analysis 2, the scenarios showed a significant increase in the area selected as more years of data were added to the scenarios, with the exception of the S10-S9 comparison for which there were no significant differences.

Maps of the 10 planning scenarios showing the averaged selection frequency of the a planning units (PUs; the percentage of times a PU was selected when run in Marxan 100 times) of all the replicates for the (a) Analysis 1 (conservation features and threats data derived from the same combination of years) and (b) Analysis 2 (conservation features and threats data derived from a different combination of years).
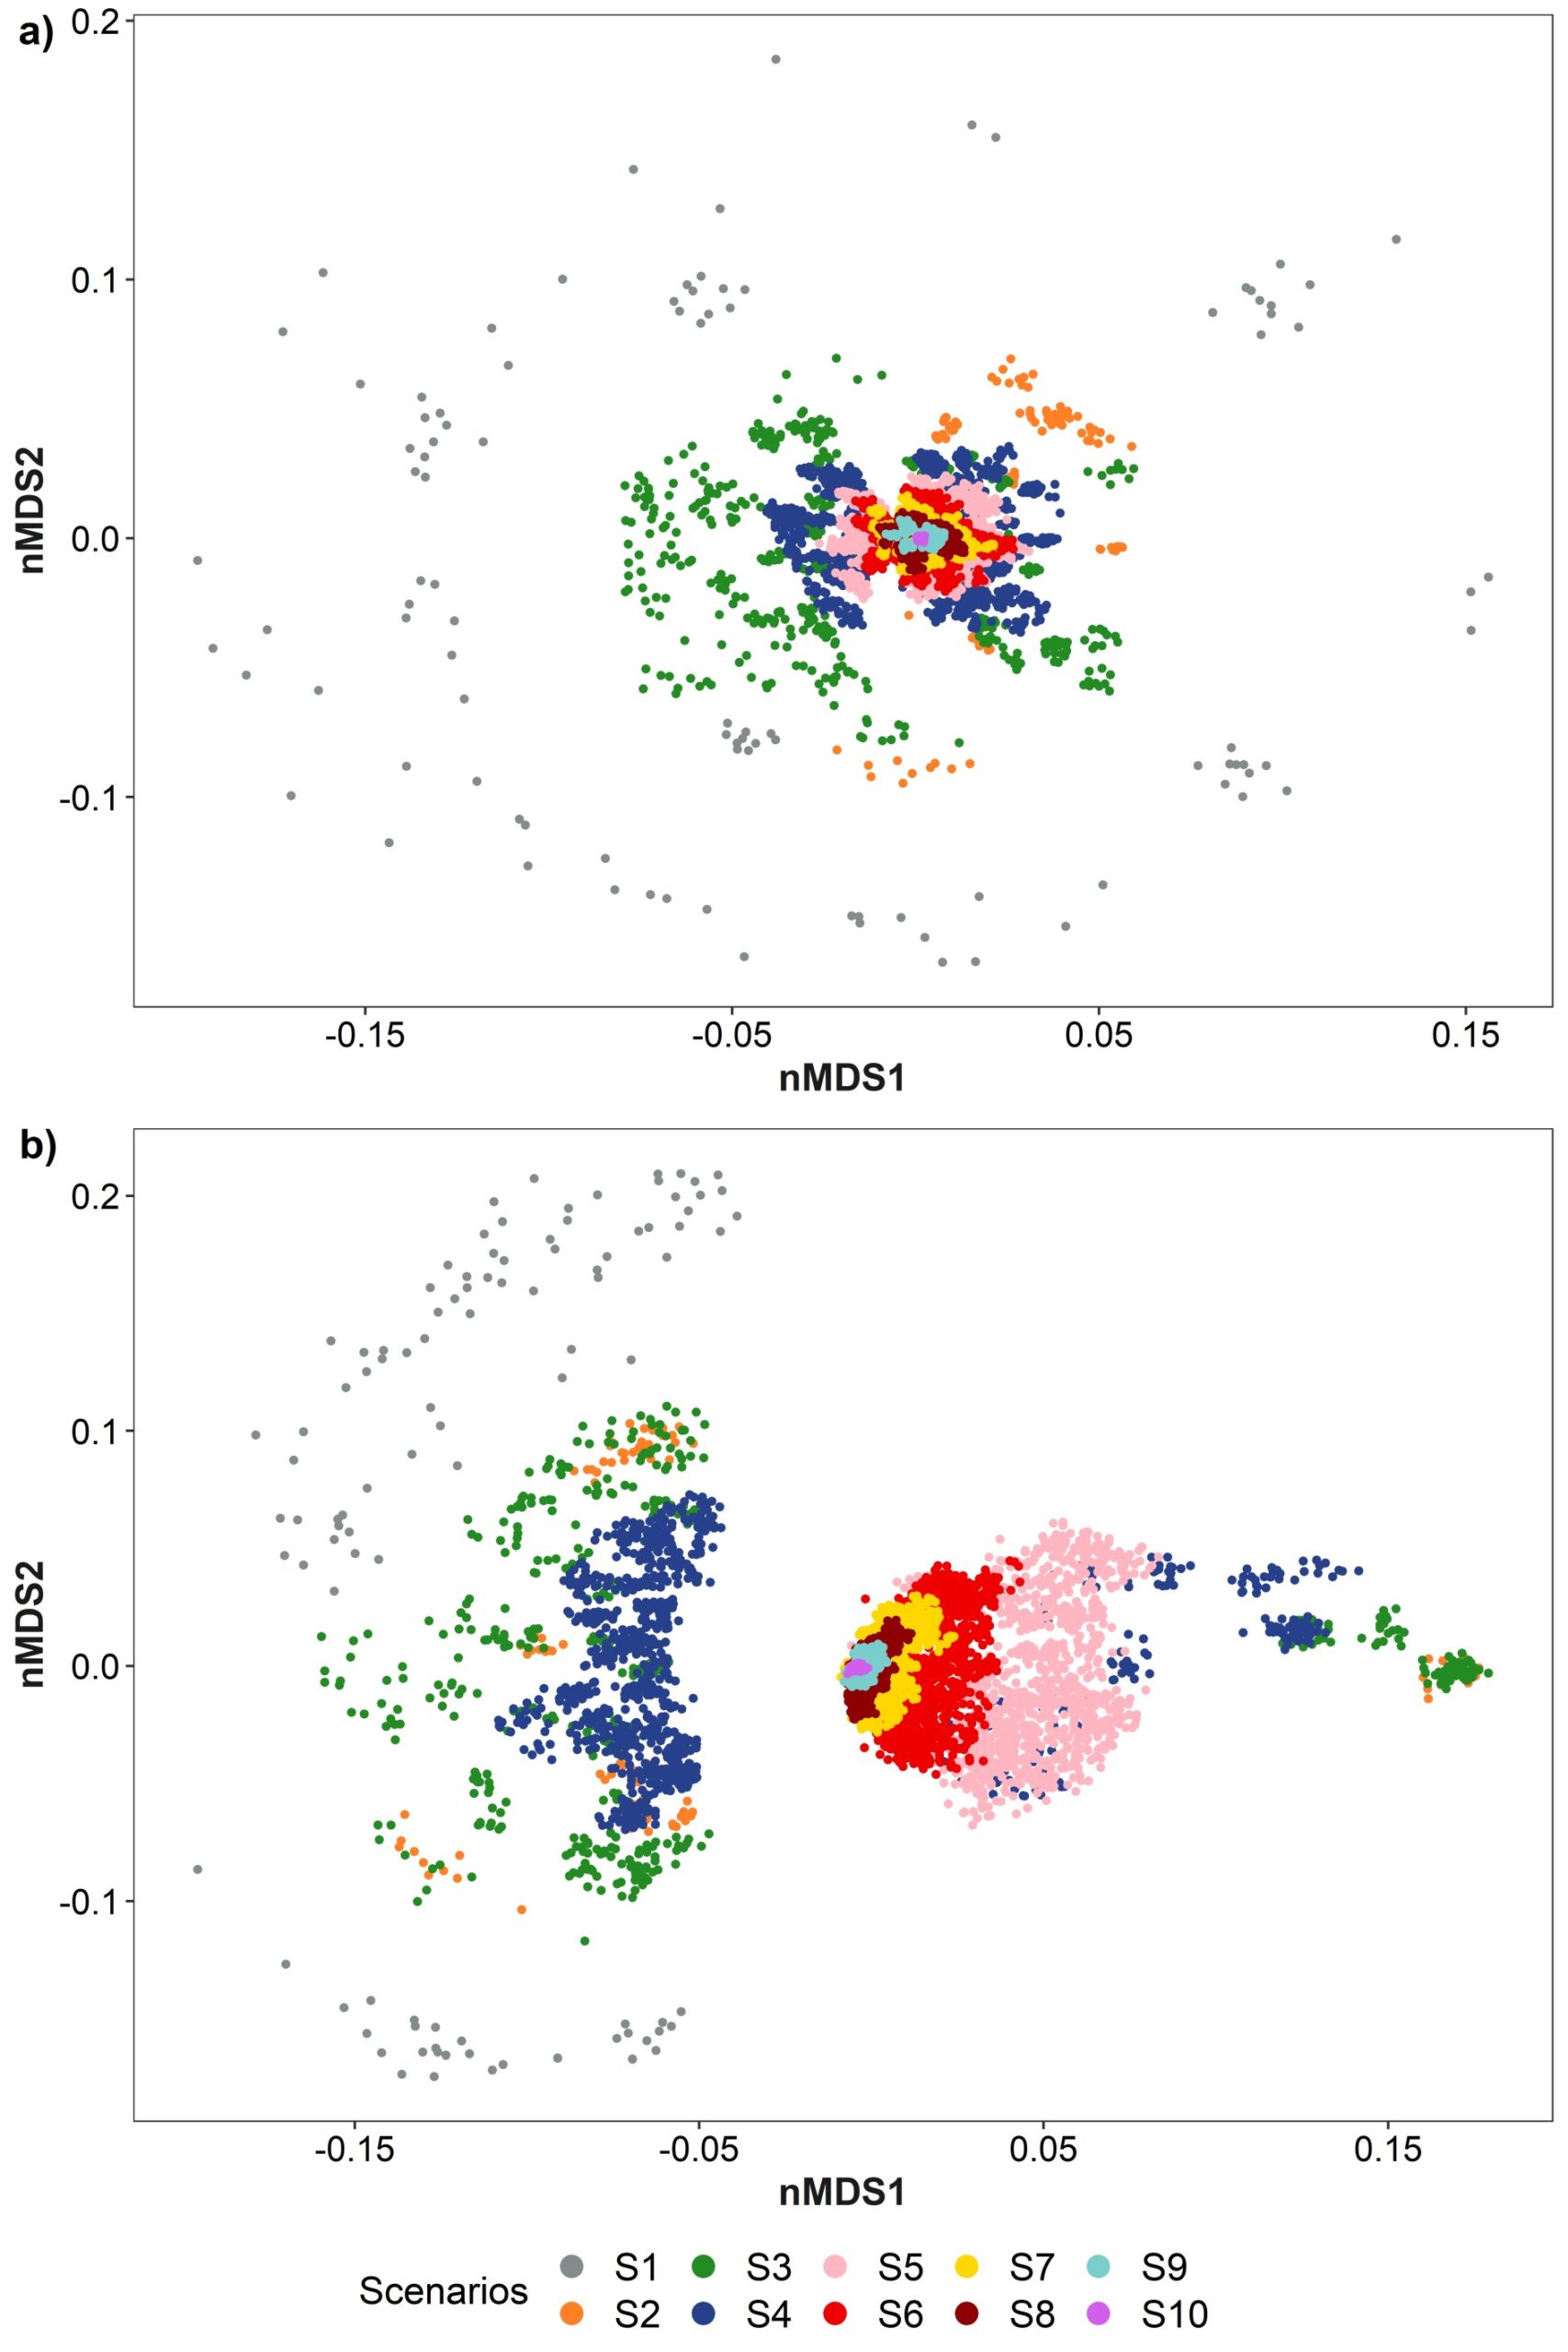
Relationships among solutions of the replicates of the 10 scenarios by means of an non-metric multidimensional scaling (nMDS) plot based on a Jaccard resemblance matrix of the (a) analysis 1 and (b) analysis 2
Determination of an appropriate temporal coverage
This study presents a method to assess the minimum temporal coverage (i.e., number of years, months, etc. of monitoring) required for the spatial planning of an efficient network of protected areas through time. We showed that relying on less than the proper amount of monitoring data entails the risk of determining priority conservation areas that are too restricted or inappropriate for the conservation of mobile species. Thus, although our analyses did not identify a clear threshold of temporal data beyond which priority areas are consistent, the tests performed on Marxan best solutions showed that scenarios with more than 4 years of data resulted in spatial planning solutions with almost perfect agreement and identified priority conservation areas that were missed in the scenarios run with shorter temporal coverage. This method allows the determination of an appropriate temporal coverage (i.e. length of time series) for the spatial planning of a consistent MPA network, and can be developed into a useful tool for conservation planning and adaptive management, usually hampered by limited resources.
References:
References
García‐Barón, I., Giakoumi, S., Santos, M. B., Granado, I., & Louzao, M. The value of time‐series data for conservation planning. J. Appl. Ecol. 58, 608-619. https://doi.org/10.1111/1365-2664.13790
Contact Information:

Isabel García-Barón
AZTI, Marine Research, Basque Research and Technology Alliance (BRTA)
isa.garciabaron@gmail.com

Sylvaine Giakoumi
Zoological Station Anton Dohrn, Naples, Italy
sylvaine.giakoumi1@gmail.com


