Marine Protected Areas in the English Channel
Background
The English Channel is the busiest channel in the world with over 500 ships per day passing through. Here commercial fishing is a crucial economic activity, but these commercial objectives need to be carefully balanced with conservation goals. This is not only to ensure the persistence of biodiversity, but also to ensure the persistence of the commercial fishing industry. Using Marxan with Zones, Metcalfe et al identified zoning configurations of “no-take” and “limited-take” options and analysed the trade-offs between competing objectives.
Marine protected area network design
The analysis followed the principles of marine protected area (MPA) network design by representing broad biodiversity surrogates (habitats) and species of conservation concern. This involved: (i) compiling biodiversity data on 34 species and 24 benthic habitat types in the eastern English Channel, known collectively as conservation features; (ii) setting representation targets for how much of each feature should be protected in UK and French waters; (iii) dividing the eastern English Channel into a number of 31·4 km2 planning units to match a system developed for an existing Ecospace model; (iv) calculating the amount of each conservation feature in each planning unit; (v) assigning a cost to each planning unit based on vessel monitoring system (VMS) effort data for eight fishing fleets (beam trawls, demersal otter trawls, dredges, pelagic trawls, hooks and lines, nets, seines, and traps and pots); and (vi) using spatial prioritization software to identify a near‐optimal set of planning units (referred to as portfolios hereafter) that when combined meet these representation targets, whilst minimizing fragmentation levels and planning unit costs.
The five spatially most different Marxan portfolios (hereafter referred to as priority area maps) that met all the targets and minimized costs were identified after 500 runs. These five priority area maps then formed the basis of the analysis, where the impacts of changing the percentage of each priority area map that belonged to two different management zones were investigated. These two zones were defined as: (i) ‘no-take’ that would exclude all fishing fleets and (ii) ‘limited-take’ that would exclude fleets using mobile bottom gears (beam trawls, demersal otter trawls, dredges), because these gears damage some habitat types and have been linked to stock declines. To do this, we used Marxan with Zones to modify each of the priority area maps and identify six portfolios based on setting targets that 0%, 20%, 40%, 60%, 80% and 100% of each conservation feature should be assigned to a limited-take MPA, with the rest being assigned to no-take MPAs.
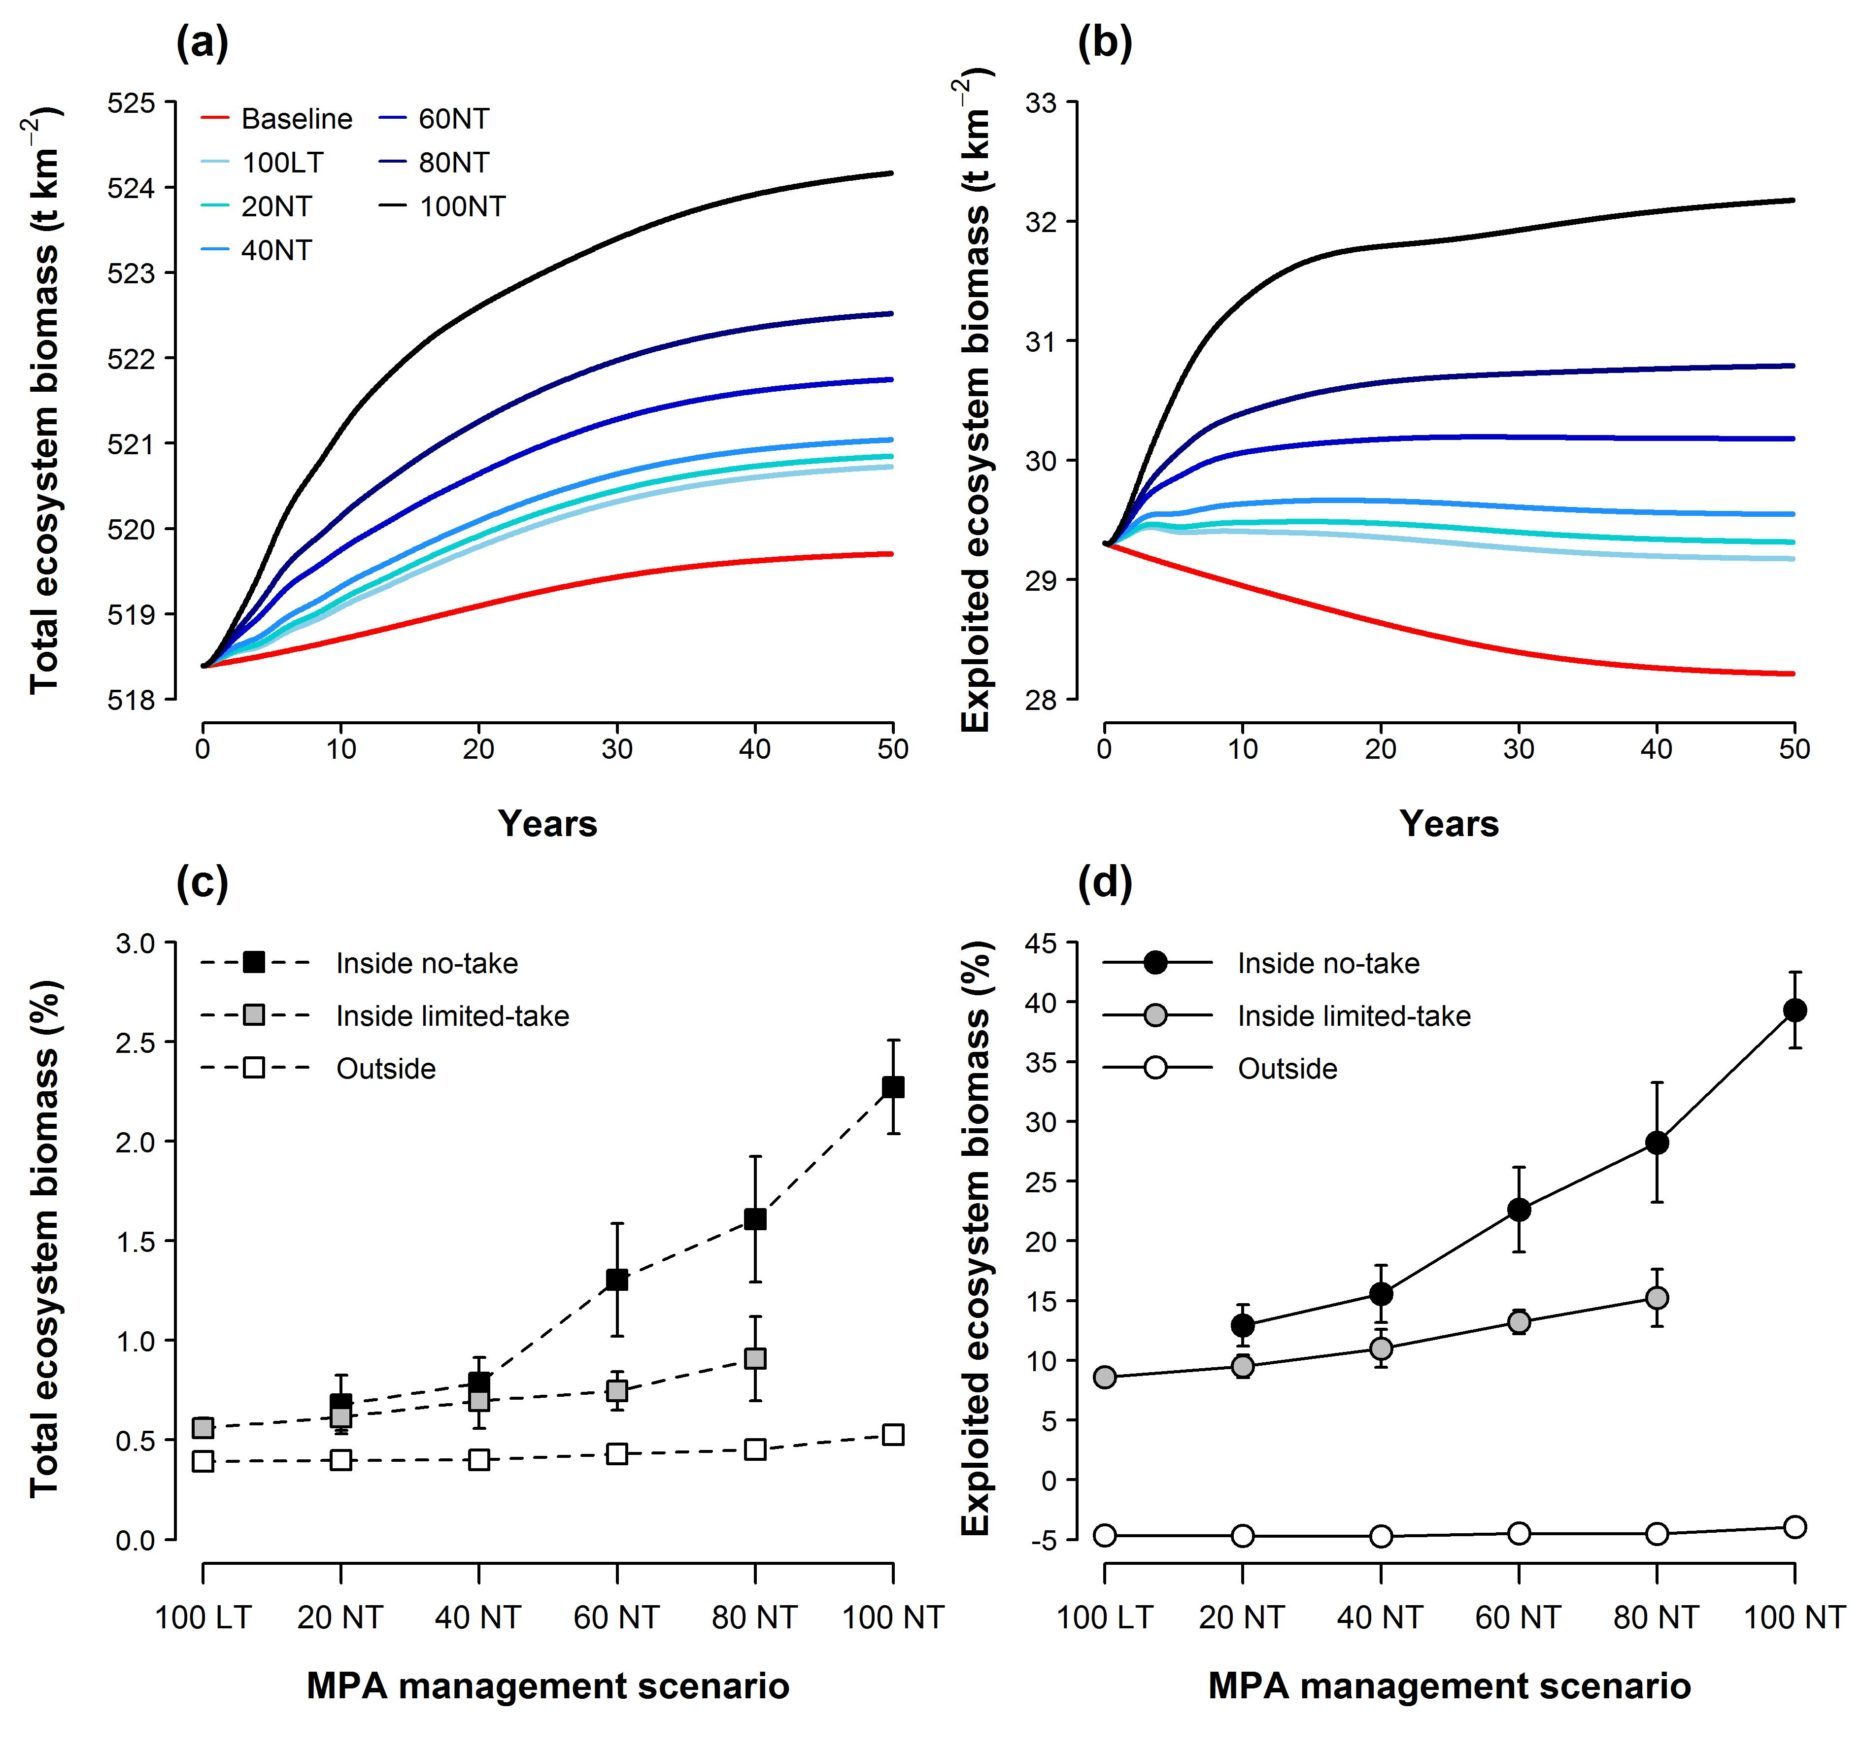
Change over time (0–50 years) in mean (a) total and (b) exploited ecosystem biomass (t km2) relative to the baseline scenario with no MPAs (solid red line), and mean percentage change (±95% confidence intervals) in the density of (c) total and (d) exploited ecosystem biomass inside and outside of MPAs for each management scenario at the end of the 50 year simulations relative to when the MPA was introduced (year 0). Management scenarios defined as baseline (no MPAs), and MPA network portfolios comprised of 100% notake:100 NT; 80% no-take: 80 NT; 60% no-take: 60 NT; 40% no-take: 40 NT; 20% no-take: 20 NT; and 100% limited take zones: 100 LT.
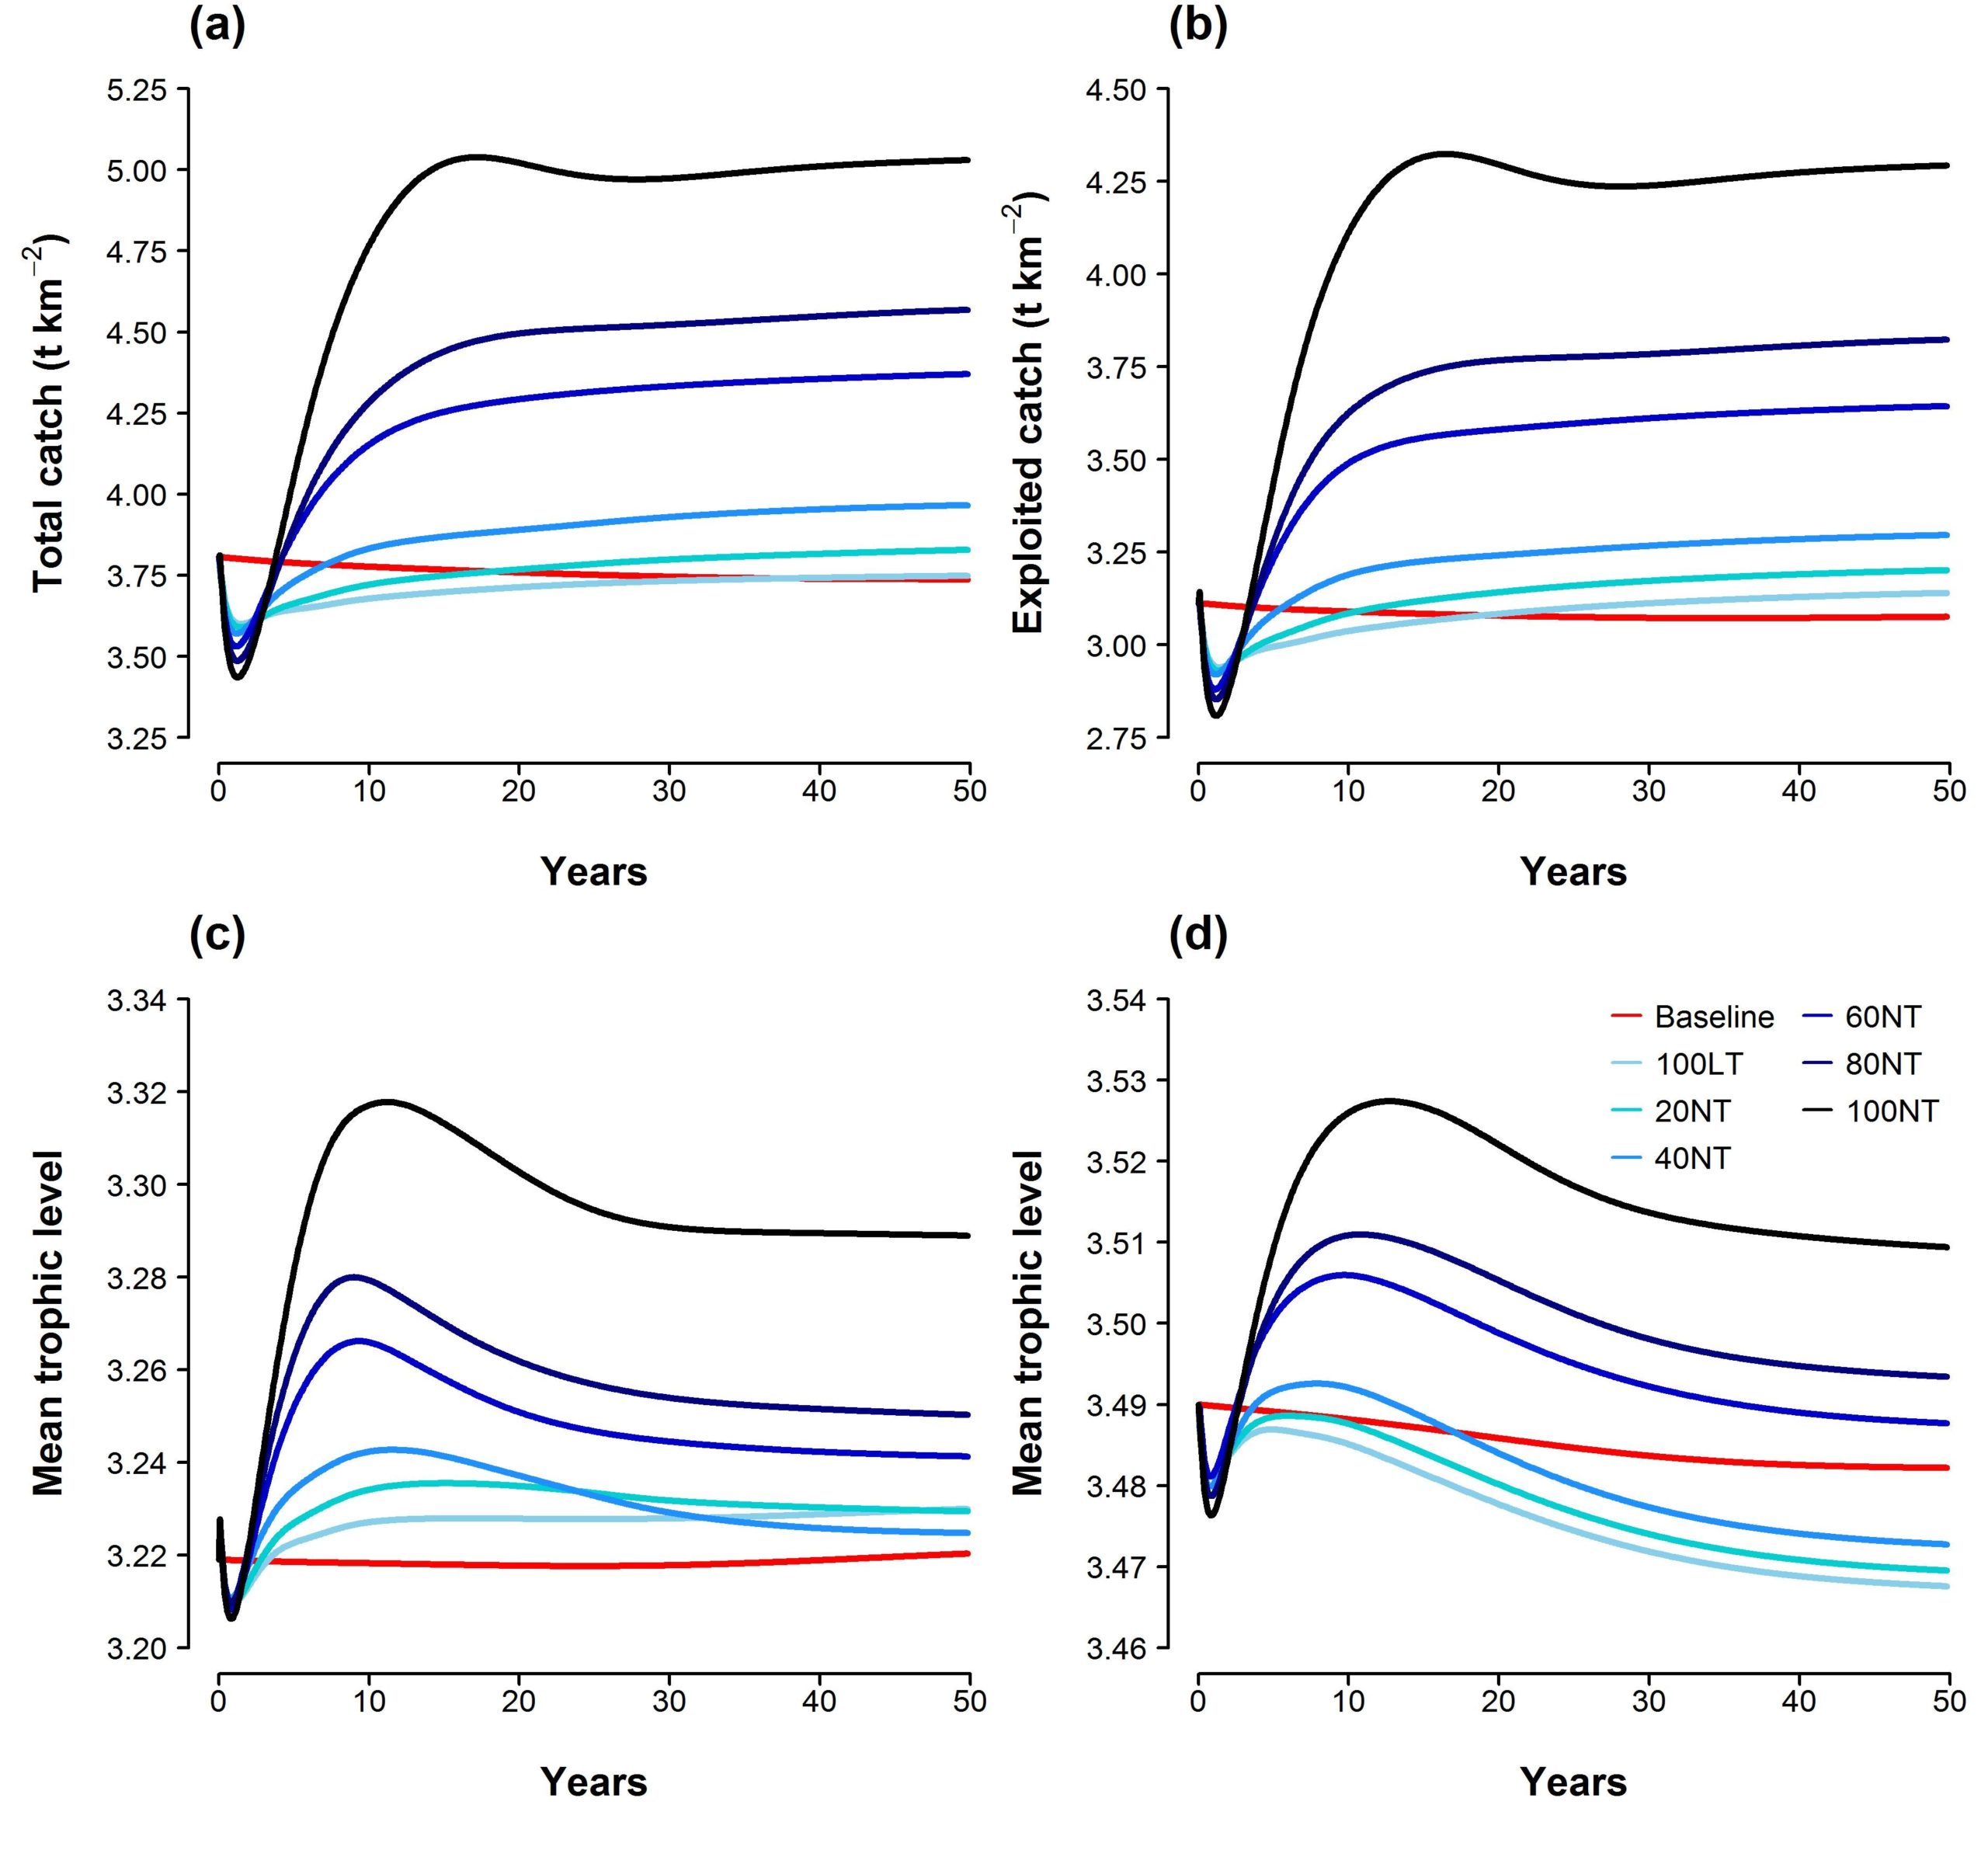
Change over time (0–50 years) in mean (a) total and (b) exploited fisheries catches (t km2); and mean trophic level of (c) total and (d) exploited catches for each MPA management scenario relative to the baseline scenario with no MPAs (solid red line).
Ecosystem Modelling
Whilst systematic planning tools are designed to identify MPA networks that both represent biodiversity and minimize impacts on stakeholders, they do not consider complex ecological processes. Thus, it is difficult to determine the impacts that proposed MPAs could have on marine ecosystem health, fisheries and fisheries sustainability. Therefore, in this study Ecospace was used, a policy evaluation tool based on spatially explicit simulation of ecosystem dynamics to investigate the impact of establishing MPA networks with different proportions of no‐take and limited‐take zones. The spatial model was based on an existing (i) ecopath mass‐balance model, which contained data on 51 functional groups (two marine mammal, one seabird, 29 fish, 15 invertebrate, two primary producers and two non‐living groups to represent discard and detritus) and eight fisheries (beam trawl, demersal otter trawl, dredges, pelagic trawl, hooks and lines, nets, seine, traps and pots, and a category ‘other’ to account for catches that could not be allocated to any of the above), and (ii) Ecosim and Ecospace model that was derived from the Ecopath model and calibrated by comparing model outputs to time series (1973–2006) and spatial data from scientific surveys and fish stock assessments.
Results
The Ecospace model revealed that each of the proposed MPA management scenarios resulted in an increase in the density of total and exploited ecosystem biomass compared to a system with no MPAs (baseline scenario), particularly for MPA networks comprised of a large proportion of no-take zones. However, the change in total ecosystem biomass was typically smaller than the change in exploited ecosystem biomass across each MPA management scenario. For example, after 50 years, a MPA network comprised of 100% limited-take zones increased the mean density of total and exploited ecosystem biomass by 0.19% and 3.41% relative to the baseline scenario. In contrast, a 100% no-take MPA network increased the mean density of total and exploited ecosystem biomass by 0.85% and 14.01%. Additionally, each of the proposed MPA management scenarios resulted in an increase in the density of total and exploited ecosystem biomass inside no-take and limited- take zones. The change in ecosystem biomass, however, was greater for MPA networks that were comprised of a large proportion of no-take zones. For example, after 50 years, a MPA network comprised of 100% limited-take zones increased the mean density of total and exploited ecosystem biomass inside of limited-take zones by 0.56% and 8.60%. In contrast, the implementation of a 100% no-take MPA network increased the mean density of total and exploited ecosystem biomass inside of no-take zones by 2.27% and 39.30%. However, even though the change in density of total ecosystem biomass remained relatively constant outside of MPAs, increasing by approximately 0.5% across all MPA management scenarios, the density of exploited ecosystem biomass (trophic level ≥2.35) outside of MPAs decreased by approximately 5%.

References:
References
Metcalfe, K., Vaz, S., Engelhard, G.H., Villanueva, M.C., Smith, R.J. and Mackinson, S., 2015. Evaluating conservation and fisheries management strategies by linking spatial prioritization software and ecosystem and fisheries modelling tools. Journal of Applied Ecology, 52(3), pp.665-674. https://doi.org/10.1111/1365-2664.12404
Contact Information: