
Planning for Nature and people in Chile
The study region comprises the central zone of Chile (32°S and 40°S, Figure 2) covers approximately 148,000 km2, with elevation ranging from 0 to 6,500 m a.s.l. Characterised by a Mediterranean-type climate (i.e. warm, dry summers and cool, wet winters), mean daily maximum temperatures range from 20°C in summer to 8°C in winter, and annual precipitation ranges from 250 mm (January–December) to 700 mm (June–August), increasing with altitude and latitude. The region is one of 35 global biodiversity hotspots with more than 1,600 endemic species. The current system of public parks comprises 65 protected areas, including natural monuments (IUCN category III), national parks (IUCN category II), national reserves and natural sanctuaries (IUCN category IV). The size of the 65 protected areas varies from <1 to 785 km2, with 27 protected areas smaller than 10 km2.
Using systematic conservation planning methods, we identified priority areas for extending the existing protected area system that: (a) minimise land acquisition cost, (b) maximise social accessibility and (c) optimise for both cost and accessibility.
Conservation features, scenarios and costs
We compare four scenarios for biodiversity performance, land acquisition cost, and social accessibility and discuss the implications for protected area selection for both people and nature in Chile and more broadly. For the scenarios, we took as a baseline scenario the existing protected area system inclusive of both public and private protected areas as derived from the Chilean Ministry of Environment database. We included all existing public reserves (65 public protected areas) and private conservation areas (95 private protected areas) in every scenario. We compared the baseline scenario with three different conservation scenarios, the first minimising land acquisition cost (minimise land cost), the second maximising social accessibility (maximum penalty for social access) and the third optimising for both low cost and high accessibility (combined land cost and social access).
For the minimum land cost scenario, we developed a map of the average acquisition value of land in USD per hectare. This land acquisition cost proxy was developed based on a look-up table assigning the reported average economic values to categories of agricultural productive land. These categories are a combination between the administrative region and geological district. For the maximum penalty for social access scenario, we penalised social inequality favouring the selection of priority areas closest to municipalities that currently have low social access.
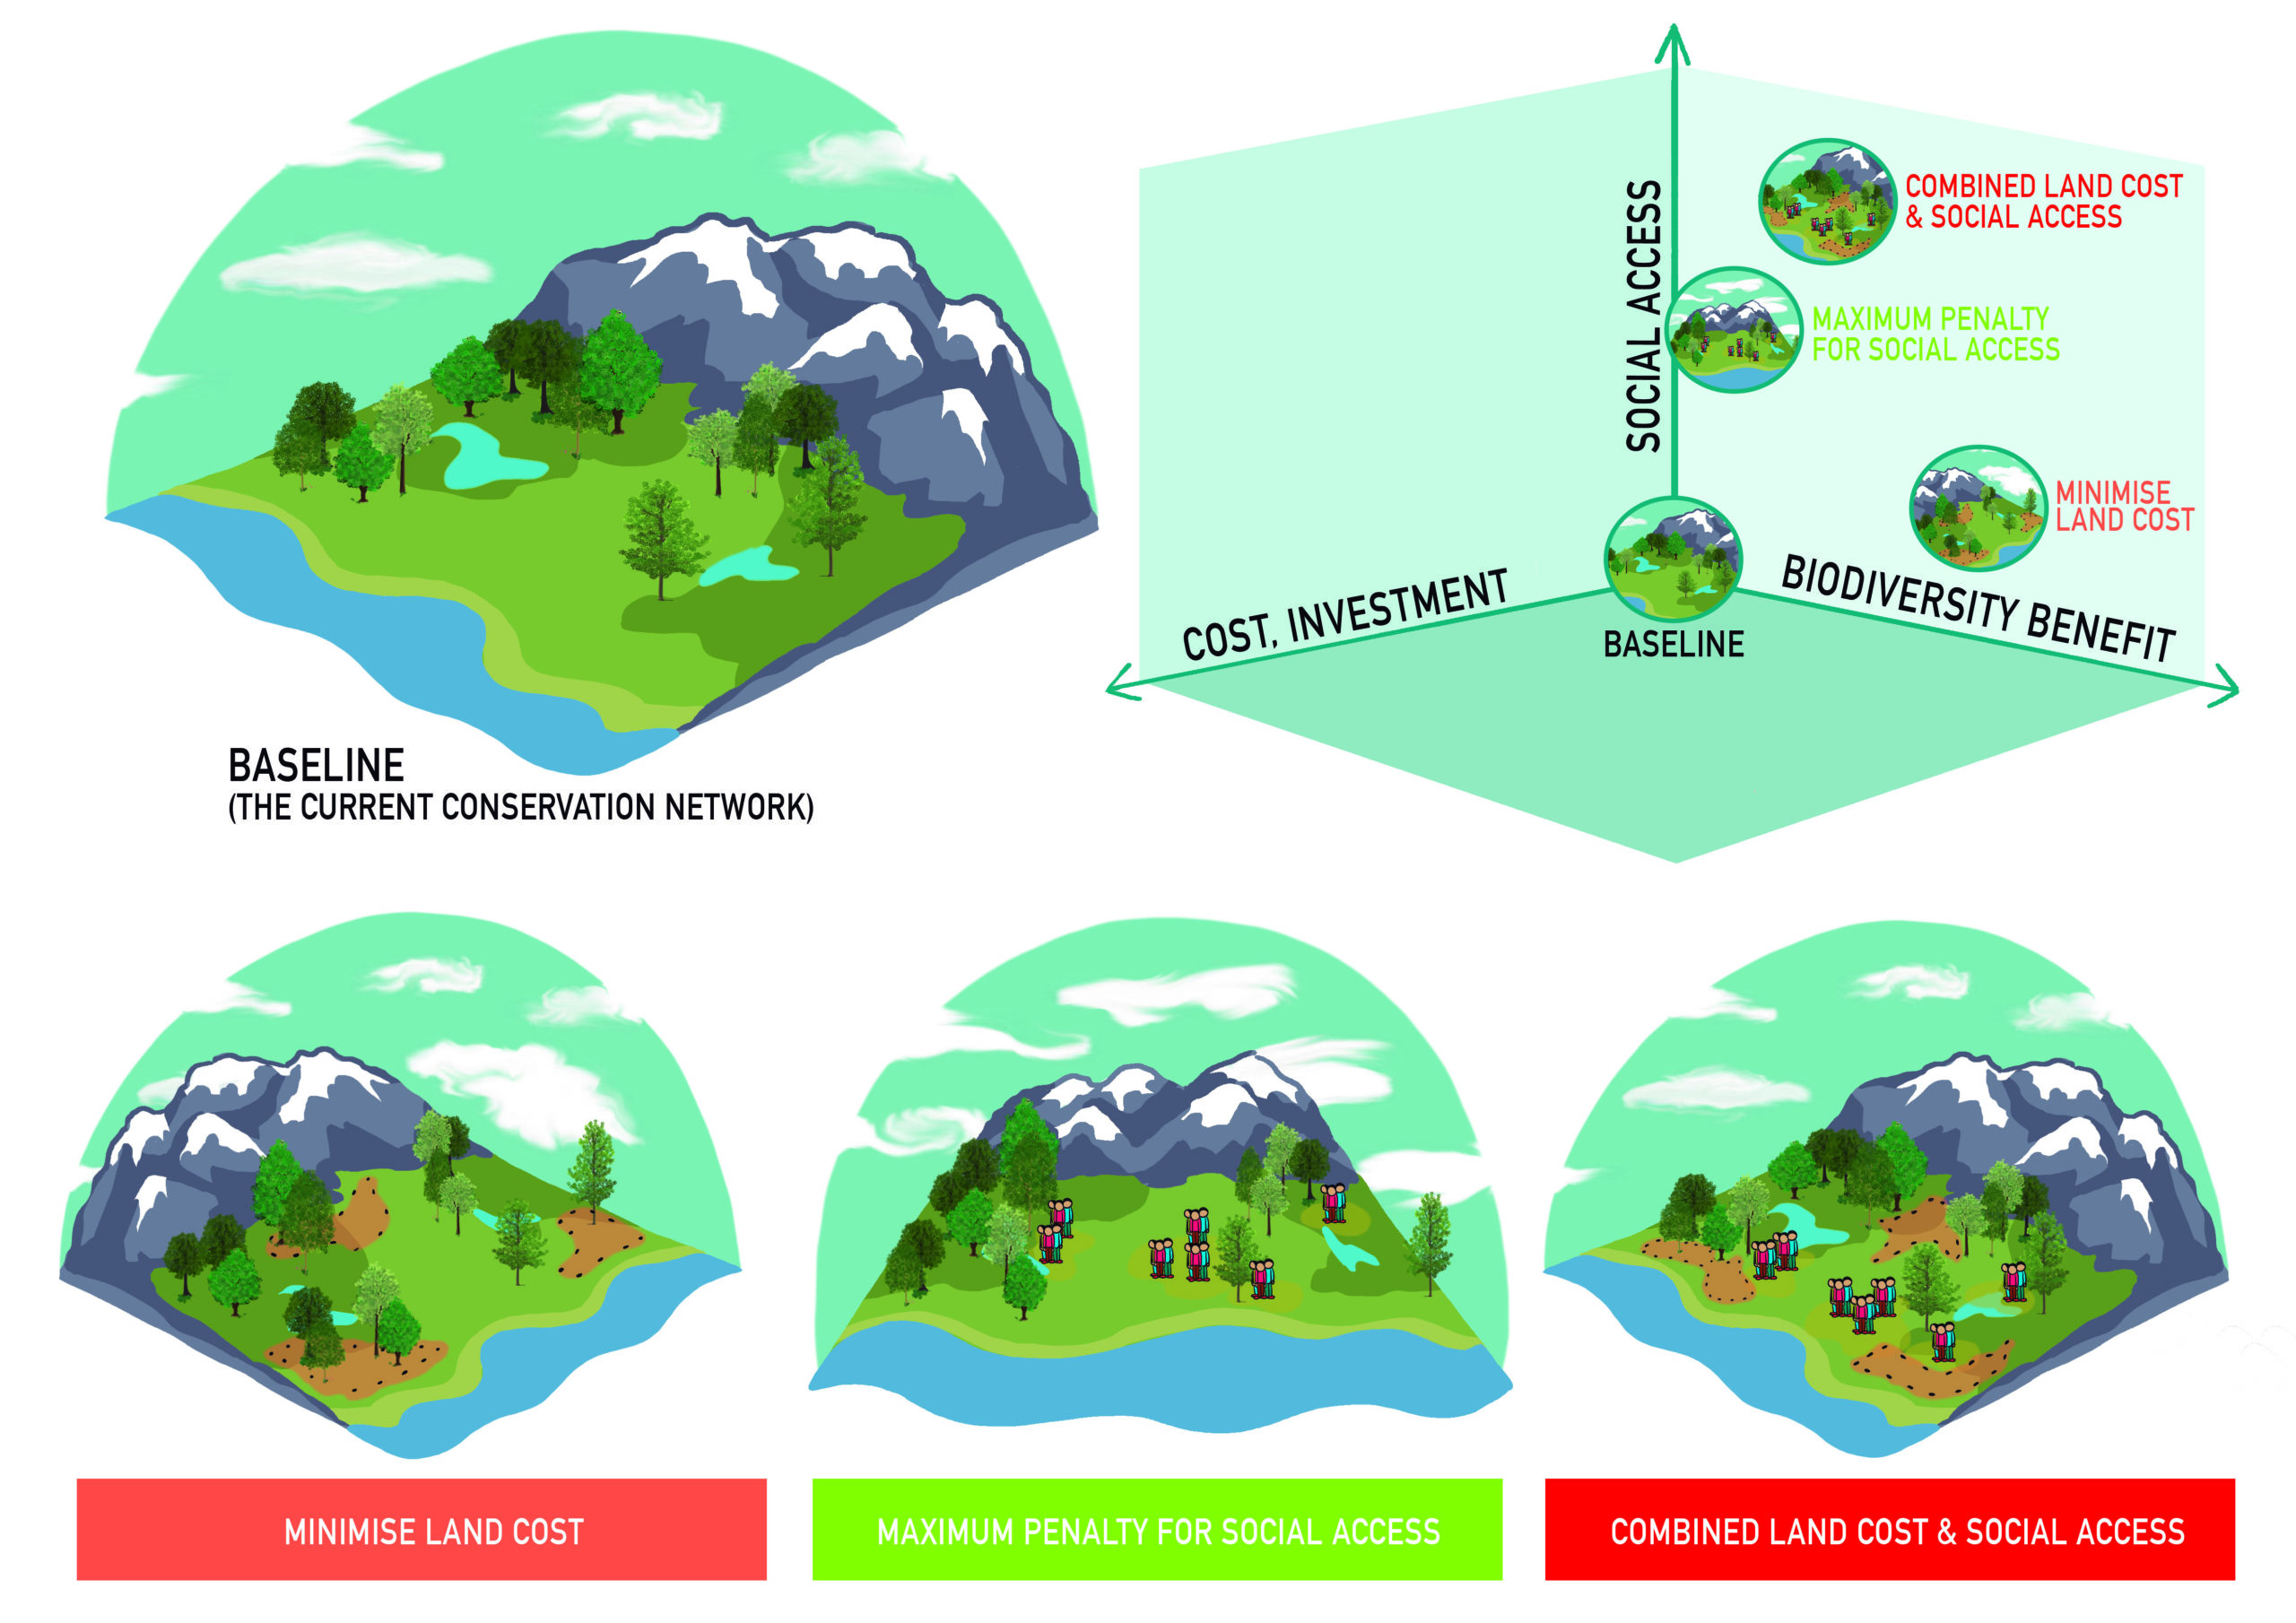
Representation of the conservation prioritisation to optimise the spatial configuration of the expansion of protected area networks for conserving biodiversity and increasing social accessibility at the minimum cost. The baseline scenario was compared against a: minimise land cost scenario which prioritises the selection of less expensive planning units minimising the land acquisition cost, the maximum penalty for social access which penalised social inequality access to cultural ecosystem services, favouring the selection of priority areas closest to municipalities that currently have low access. The combined land cost and social access scenario that seeks to reduce land cost and maximise social accessibility at the same time
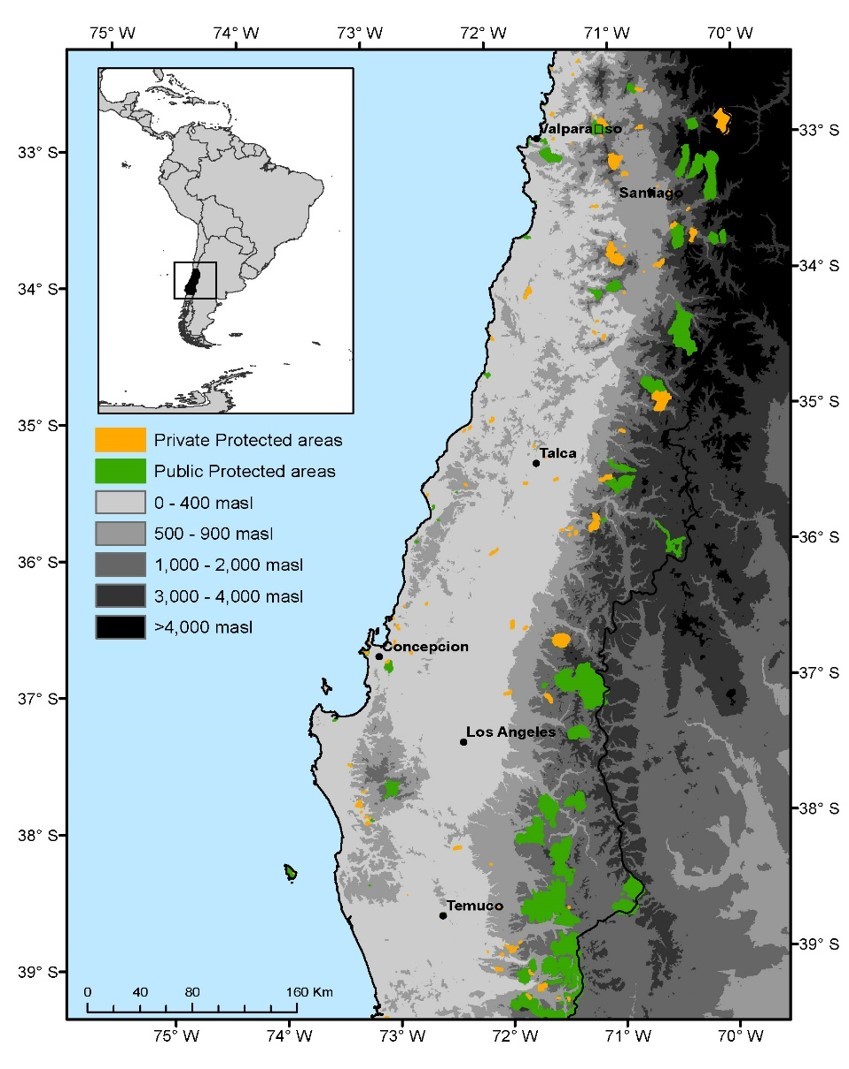
The study area highlighting the protected area system (public and private) and the elevation in metres above sea level (m a.s.l.)
To reduce the current inequality in social access, the social accessibility layer, that highlights higher and lower access to cultural ecosystem services in existing protected areas (Martinez-Harms et al. 2018 https://doi.org/10.1016/j.scitotenv.2018.04.353), was used as a ‘cost’ surrogate in Marxan. We aimed to maximise social accessibility from poorer municipalities that are also closer to protected areas that have higher demand for providing cultural ecosystem services. The social accessibility layer was originally calculated based on a photo-visitation database developed from publicly available geotagged photographs and information of the home municipality of visitors within the photo-visitation database. Socioeconomic information such as the average income for each municipality of the study region (237 municipalities) was also collected. We used the average income of the municipalities because in the study areas there are clear divisions that favour or create opportunities for only a portion of society with higher disposable income that can enjoy greater access to the cultural benefits of protected areas.
The municipality is the smallest administrative unit for which socioeconomic data are available from the National Socioeconomic Characterization Survey undertaken by the Chilean Ministry of Planning and made freely available to the public. The social accessibility index was calculated for each municipality as the demand for cultural ecosystem services provided by each protected area divided by the distance from the protected area to the municipality, summed over all protected areas, and then multiplied by the average income of the municipality. Demand for cultural ecosystem services of each protected area was calculated as the total distance travelled by visitors to the protected area derived from a database of protected area visitation obtained from social media (Martinez-Harms et al., 2018). To calculate the land cost and social access scenario, we linearly rescaled the social accessibility penalty index in equal interval values from one to five and multiplied the rescaled layer with the land acquisition cost layer.
Spatial prioritisation
We used 1 km2 planning units (148,744 planning units) and tested the scenarios for the biodiversity features represented by the 34 native forest types. The Species Penalty Factor (SPF) determined the importance of meeting the target and in this case was kept at 1.0 for all features except those where the target was not met in the first set of runs. In those cases, we increased the SPF to 10.0 to increase the likelihood of the target being met. The boundary length modifier (BLM) is used in Marxan analysis to influence the degree of connectivity between planning units selected as conservation priorities. To encourage some ecological connectivity in the resulting area network, Marxan's BLM was set to the value of 10.0 after testing its sensitivity. We started with a BLM of zero and increased until visual inspection of the results showed the desired degree of clustering (BLM = 10). The calibration of the results was performed to ensure that the set of solutions produced were close to the optimum (lowest cost). Marxan analyses were calibrated iteratively checking the SPF values and the number of iterations needed to achieve that all targets are being met. Then all scenarios were run with 100 repetitions and 10 million iterations.
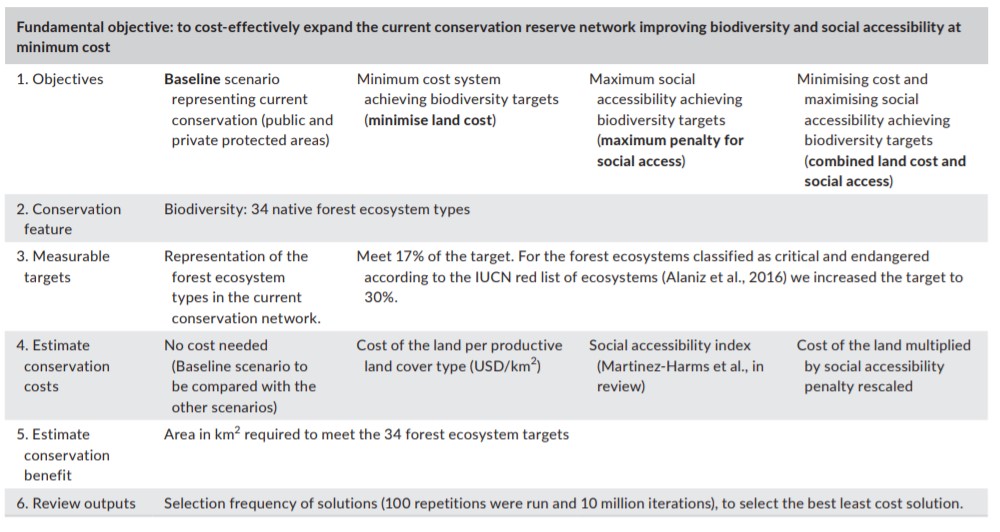
Decision framework applied to cost-effectively expand the current conservation network improving biodiversity representation and increasing social accessibility at minimum cost in the Mediterranean region of Chile
Spatial prioritisation
The Jaccard coefficient, is a statistic used for measuring the similarity between finite sample sets, and is defined as the size of the intersection divided by the size of the union of two sample set. In this case the intersection is the number of only those planning units that the two scenarios have in common, in terms of the planning units that were selected >40% of the 100 runs (i.e. the number of matching priority sites). The union is total number of planning units selected >40% belonging to either of the two scenarios. The Jaccard coefficient range from 0 to 1, the higher the coefficient value represents that the two sample sets are more similar. We spatially represented these similarities by comparing the scenarios by pair.
Results
We found that it is possible to improve social accessibility while simultaneously minimising land cost. Considering cost alone, the protected area system could be expanded to improve biodiversity conservation by 86% at the cost of $47 million USD, which would also increase the accessibility of protected areas by 12%. Accessibility can be increased by a further 18% by jointly considering cost and accessibility without compromising the cost or biodiversity performance.
The subset of candidate priority areas — those always selected regardless of where the selected areas were located — for the scenarios especially prioritized the protection of the coastal Mediterranean forests. In these landscapes, native vegetation clearing has left few options for meeting biodiversity and access to cultural ecosystem services targets.
There is an urgency to improve conservation in this region where the protected area system is inversely proportional to species endemism and richness. The situation of the Mediterranean-type sclerophyllous ecosystems of Chile is especially critical with a current protected area network that only covers a small proportion of the remnant forests. The outputs could help unlock new conservation opportunities in this region, by identifying land parcels that could greatly improve biodiversity and social access to nature and help determine which action to undertake in a given location. New private conservation policy developed in Chile could help offset the costs of conservation through novel public–private partnerships. In the study region most of the remaining area with high conservation value remains on private land and our study can be useful as one of the key strategic activities in the implementation of this new policy to cost-effectively identify strategic sites and landowners to enable private land conservation in the region.
Incorporating social accessibility into conservation planning, can bring people closer to protected areas, without compromising costs however, we do not know that this is without compromising the protection of biodiversity. Increasing social accessibility could also mean that these areas could experience more environmental pressures from visitors. Planning for social accessibility should be done carefully to protect biodiversity through the development and enforcement of protected area management plans.
Our results can provide specific guidance to policymakers to strategically identify new locations for protected areas which cost-effectively improve biodiversity conservation, while at the same time reducing inequality in social accessibility. In Chile there are high levels of inequality affecting all dimensions of human well-being such as access to education, health, and social security and also access to nature. The social accessibility cost layer used in this study can allow conservation policy to also address social inequality of access to nature by identifying alternatives that improve people’s access to protected areas without compromising economic costs. The consideration of social access in reserve design could increase the success of protected areas as a conservation tool by bringing people closer to nature.

Selection frequency (SF) maps of sites achieving a 17% for each of the 34 forest ecosystem types: (a) scenario minimise land cost, (b) the maximum penalty for social access scenario and (c) combined land cost and social access scenario
References:
References
Martinez‐Harms, Maria Jose, et al. "Conservation planning for people and nature in a Chilean biodiversity hotspot." People and Nature (2021).
Contact Information:
Maria Jose Martinez-Harms
Center for Applied Ecology and Sustainability (CAPES), Pontificia Universidad Catolica de Chile, Santiago, Chile
Instituto Milenio en Socio Ecología Costera (SECOS), Pontificia Universidad Católica de Chile, Santiago, Chile
Instituto de Ecología y Biodiversidad (IEB), Santiago, Chile


