
Conservation areas for top predators
Background
Raptors are placed at the upper level of trophic cascade, representing a bird guild very sensitive to the impacts of environmental changes on both nesting and foraging habitats. Raptors’ performance and fitness strongly depends on interannual fluctuations of prey availability —mostly primary consumers which in turn depend on primary productivity dynamics. The main objective of our study was to (1) to investigate the potential of remotely sensed descriptors of primary productivity to model habitat dynamics of top predators, using raptors as case study, and (2) develop a framework to incorporate primary productivity dynamics into raptors conservation prioritization. To do so, we computed spectral vegetation indices from a comprehensive time series of satellite images (from the MODIS archive) to characterize interannual variability and seasonality of primary productivity in a highly dynamic landscape of Northwest Iberia —largely affected by land-use change, market-oriented forest management coupled with a high frequency of wildfires.
The study region was the province of Ourense (c.7281 km2), located in the south-east of Galicia (Northwest Iberian Peninsula), at the transition between the Atlantic and Mediterranean biogeographic regions. Average annual rainfall ranges between 700 and 2000 mm, and annual mean temperature between 6.3 and 14.5 °C. Elevations are higher (up to 2071 m a.s.l.) in the east and lower (down to 29 m) in the western river valleys. The study area has undergone gradual abandonment since the mid-20th century caused by rural exodus and the subsequent cessation of traditional agro pastoral activities. The former landscape characterized by complex mosaics of crop and woodland patches has been progressively replaced by homogeneous landscapes mainly dominated by forests and shrublands. The area is subjected to an anthropogenic fire regime, characterized by a high frequency of forest fires linked to the socio-economic constraints and reshaping of rural communities.
Remotely sensed ecosystem functioning indicators
The need to incorporate habitat dynamics into spatial conservation prioritization is increasingly recognized but often limited by the lack of available temporal data. To overcome this limitation, model-assisted monitoring has been advocated and developed over the last decade. However, predictive modelling often relies on static habitat features or interpolated climate data, failing to consider other relevant ecological processes such as primary productivity and its dynamics. The importance of primary productivity relies on its key role in determining the availability of food resources via trophic cascades.
Remote-sensing products from the MODIS (Moderate Resolution Imaging Spectroradiometer) archive were selected to describe ecosystem functioning attributes (hereafter: RS-EFAs). MODIS data are a good compromise in terms of spatial and temporal resolution, considering the large home ranges of our target species and the limited availability of images from other satellites (e.g. Landsat mission). We used the Enhanced Vegetation Index (EVI) (MOD13Q1.006) as surrogate for primary productivity dynamics, for the 2001–2017 period, at the original spatial resolution of 230 m. EVI presents several advantages over other vegetation indices (such as SAVI, ARVI, or NDVI) as it is more reliable in both low and high vegetation cover situations, and more resistant to soil influences, canopy background signals and atmospheric effects.

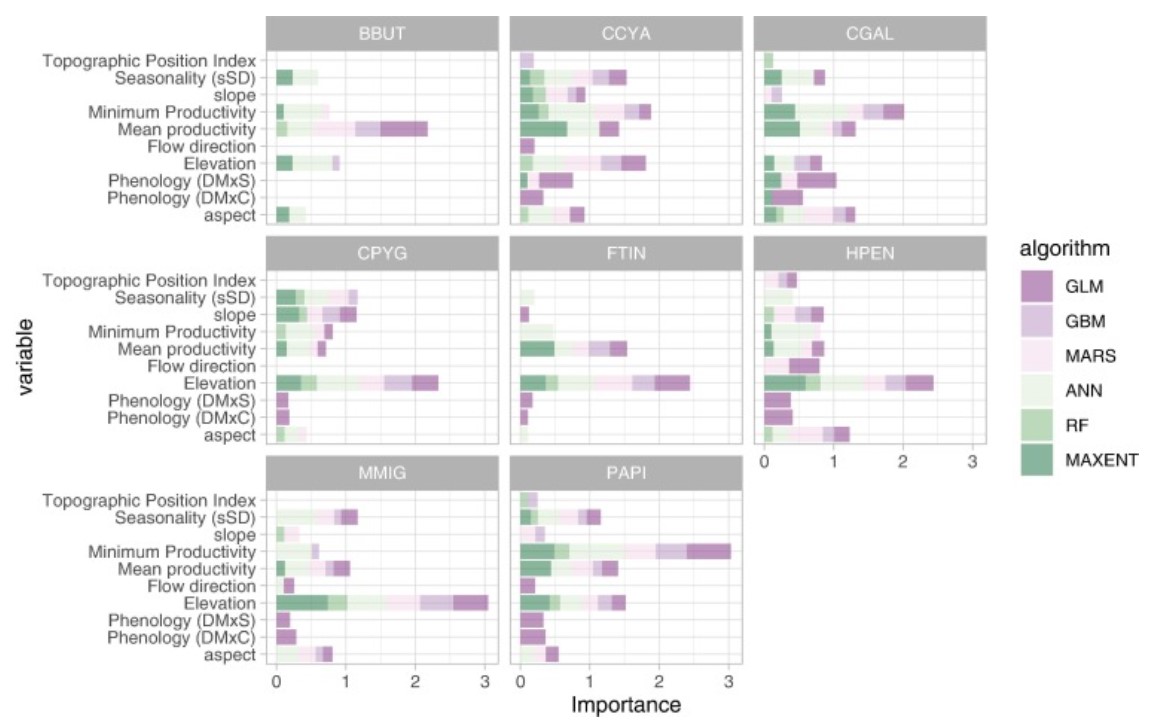
Variable importance across all individual models for each modelling technique and target species. Acronyms: Pernis apivorus (PAPI), Milvus migrans (MMIG), Circaetus gallicus (CGAL), Circus pygargus (CPYG), Circus cyaneus (CCYA), Buteo buteo (BBUT), Hieraaetus pennatus (HPEN), Falco tinnunculus (FTIN).
Habitat suitability models
Habitat suitability models for species were developed using six modelling techniques available in the R package ‘biomod2’: generalized linear models (GLM), generalized boosted models (GBM), multivariate adaptive regression splines (MARS), maximum entropy (MaxEnt), random forest (RF), and artificial neural networks (ANN). Presence data for model fitting consisted of the geo-located observations gathered during the field surveys in both years 2001 and 2014. Pseudo-absences were taken from the presence points of the other species recorded during the same surveys. Covariates consisted of environmental conditions derived from the remote-sensing variables for the specific year at which each occurrence was recorded in order to better characterize habitat conditions.
Results
The annual predictions derived from ensemble HSMs were used to inform simulations, to identify priority areas for raptor conservation for each year, from 2001 to 2017 using Marxan. Model performance and transferability was high for all raptor species. Model predictions showed a large interannual variation in habitat availability during the focal period. Our models also predicted large declines in species’ habitat availability for years 2008 and 2014, mainly for open habitat dwelling species such as Montagu’s harrier and Hen harrier, with the exception of more generalist species (e.g. Common buzzard and Black kite Milvus migrans).
This interannual dynamics of habitat availability was translated into marked changes in the priority areas identified by MARXAN (as represented by the priority-area indices). From the initial set of seven priority-area indicators – derived from MARXAN simulations between 2001 and 2017 – three were highly correlated and were not considered for further analyses. A priority-area system derived from a static approach (i.e., based on MARXAN simulations for year 2017) included a large proportion of areas ranked as low (19%) and medium–low priority (52%) by the dynamic approach (i.e., based on the combination of our dynamic priory-area indicators). Our priority-area indicators were mostly correlated with deciduous forests and water environments (rivers and dams) in the co-inertia analysis.

Priority-area indicators derived from MARXAN simulations between 2001 and 2017: legacy: relevance (‘TSD’: measured as the time – expressed in years – since last designation as priority area by MARXAN, considering 2017 as reference year), adequacy: long-term cost-efficiency (‘Rec-bSol’: measured as the number of times a site has been selected as priority between 2001 and 2017), stability: temporal variation (‘SD-Irr’: measured through the Standard Deviation [SD] of irreplaceability values across the time period) and stability: risk-to-reward ratio (‘CV-Irr’: measured through the Coefficient of Variation [CV] of irreplaceability values across the time period). Black lines represent the limit of the current network of Special Protection Areas (SPAs) for birds.

Priority areas identified under static (grey color represents the ‘best solution’ from MARXAN simulations for year 2017) and dynamic approaches (green colors represent the priority levels obtained from the combination of the priority-area indicators). The four non-correlated priority-area indicators derived from MARXAN simulations between 2001 and 2017 were combined by applying the following expression: [Rec-bSol > 10 times] + [TSD < 5 years] + [SD-Irr > 0 & <25] + [CV-Irr > 0 & <20]. Black lines represent the limit of the current network of Special Protection Areas (SPAs) for birds. Bar plot shows the percentage of the priority areas (ranked from low to high priority according to the dynamic approach) within the static MARXAN solution for year 2017. (For interpretation of the references to color in this figure legend, the reader is referred to the web version of this article.)
References:
References
Regos, Adrián, et al. "Using remotely sensed indicators of primary productivity to improve prioritization of conservation areas for top predators." Ecological Indicators 125 (2021): 107503.
Contact Information:

Adrián Regos
Departamento de Zooloxía, Xenética e Antropoloxía Física, Universidade de Santiago de Compostela, 15782, Spain


